Q. The bar graph given below shows the data of the production of paper (in lakh tonnes) by three different companies X, Y and Z over the years.
Production of Paper (in lakh tonnes) by Three Companies X, Y and Z over the Years.
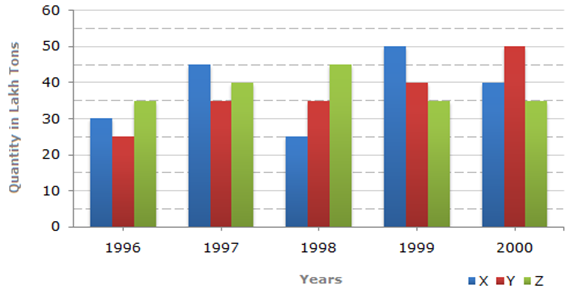
(a) For which years, the percentage rise/fall in production from the previous year is the maximum for Company Y? 6
(b) What is the ratio of the average production of Company X in the period 1998-2000 to the average production of Company Y in the same period? 6
(c) The average production for five years was maximum for which company? 6
(d) In which year was the percentage of production of Company Z to the production of Company Y the maximum? 6
(e) What is the percentage increase in the production of Company Y from 1996 to 1999? 6
(f) What is the difference between the production of Company Z in 1998 and Company Y in 1996? 6
NOTE:
- All those enrolled can send their answers for evaluation in PDF format after scanning (you can use any scanner app) on crackingcs2021@gmail.com
- Name your file as your name and day. For example, if your name is Ashok Kumar and you are sending answer of Day 1, World History, your file should be named as AshokKumar_History_Day1
- Answers will be evaluated within 2 days.
- Click here for Solution of all Daily Problem Practice Questions for enrolled students.