Q. Study the data given in the following multiple bar chart which shows the production, export and import (in ₹ crore) of country X during the period from 2006 to 2013, and answer the questions given below it.
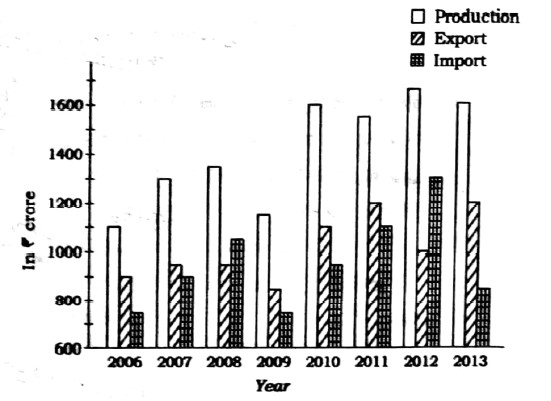
(a) In which years the ratio of export and import was maximum and minimum for country X? What were those ratios? 6
(b) In which year the highest percent of its production was exported? What was that percentage value? 6
(c) If for the country Y, the ratio of production, import and export is 7 : 6 : 5 and production in Y in the year 2014 is double the production in X in the year 2013, what was the value of the export and import from Y in the year 2014? 8
(d) What percentage of production was imported in the year 2008 and 2012 in country X? 6
(e) What percentage of export should be increased in 2007 in X so that the difference between its production and export is 1/4 of its import? 10
NOTE:
- All those enrolled can send their answers for evaluation in PDF format after scanning (you can use any scanner app) on crackingcs2021@gmail.com
- Name your file as your name and day. For example, if your name is Ashok Kumar and you are sending answer of Day 1, World History, your file should be named as AshokKumar_History_Day1
- Answers will be evaluated within 2 days.
- Click here for Solution of all Daily Problem Practice Questions for enrolled students.