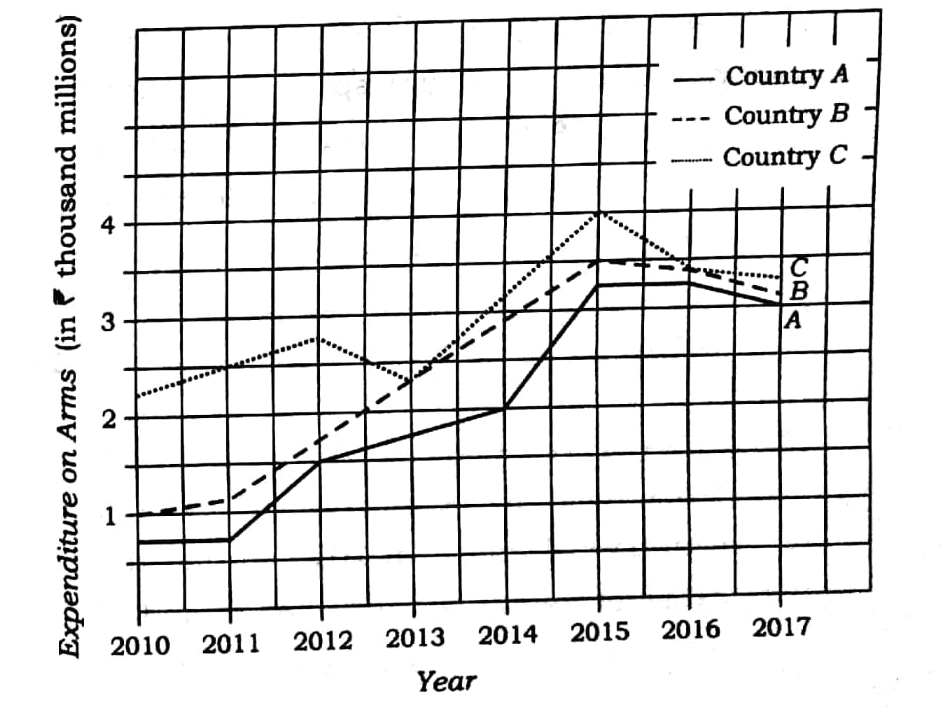
Q. The following graph shows the expenditure on arms of the three countries A, B and C (in ₹ thousand millions). Answer the questions that follow on the basis of the graph:

(a) Which country had the steepest rise in its expenditure on arms compared to the previous year and in which year? 5
(b) What was the percentage increase in expenditure on arms of country A in 2017 compared to 2012? 5
(c) The amount spent by country B in 2017 is what percentage of amount spent by it in 2011? 5
(d) If in 2018, the amount spent by country C will be 30% more than that in the last year and the amount spent by country A in 2018 remains same as that in 2017, what will be the difference between the amounts spent by the countries C and A in arms in the year 2018? 11
(e) What percentage of expenditure on arms should be increased by the countries A and B in 2015 so that the expenditure on arms by A, B and C becomes same for the year 2015? 10
NOTE:
- All those enrolled can send their answers for evaluation in PDF format after scanning (you can use any scanner app) on crackingcs2021@gmail.com
- Name your file as your name and day. For example, if your name is Ashok Kumar and you are sending answer of Day 1, World History, your file should be named as AshokKumar_History_Day1
- Answers will be evaluated within 2 days.
- Click here for Solution of all Daily Problem Practice Questions for enrolled students.

