Q. Study the following pie charts, which show the expenditure on various heads in the second and third Five-Year Plans (FYP) and answer the questions given below it: 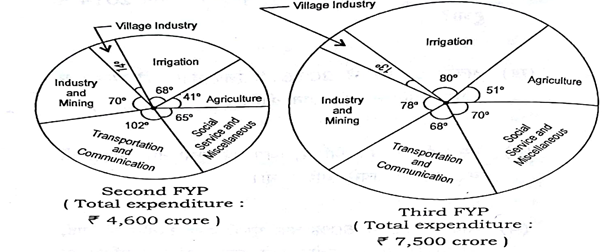 (a) By what percent, the expenditure in irrigation increased in the third FYP in comparison to the second FYP? 6
(b) What is the ratio of expenditures in village industry in the second and third FYPs? 6
(c) By what amount, the expenditure in agriculture in the third FYP should have been increased or decreased so that to make it 2.5 times the expenditure in agriculture in the second FYP? 6
(d) By what percent, the expenditure in agriculture in the third FYP is higher or lower than the expenditure in industry and mining in the second FYP? 6
(e) By what amount, the expenditure in transportation and communication increased or decreased in the third FYP in comparison to second FYP? 6
(f) If the total expenditure in the fourth FYP is increased by 80% to that of the third FYP and the segment of expenditure on social service and miscellaneous makes an angle of 78° at the center of pie chart for the fourth FYP, then what will be the expenditure in social service and miscellaneous in the fourth FYP? 6
Note:
- All those enrolled can send their answers for evaluation in PDF format after scanning (you can use any scanner app) on ccsevaluations@gmail.com
- Name your file as your name and day. For example, if your name is Ashok Kumar and you are sending answer of Day 1 for History, your file should be named as AshokKumar_History_Day1
- Answers will be evaluated within 2 days.
- Click here for Solution of all Daily Problem Practice Questions for enrolled students.