Q. The pie chart provided below gives the distribution of land (in a village) under various food crops. Study the pie chart carefully and answer the questions given below:
Distribution of Area (in acres) under various food crops.
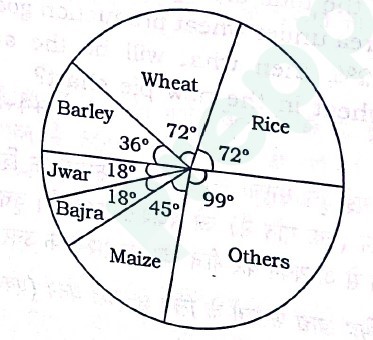
Q. Which combination of three crops contributes to 50% of the area under the food crops? 4
Q. If the total area under jwar was 1.5 million acres, then what was the area (in million acres) under rice? 4
Q. If the production of wheat is six times that of barley, then what is the ratio between yield per acre of wheat and barley? 8
Q. If the yield per acre of rice was 50% more than that of barley, then the production of barley is what percent of that of rice? 10
Q. If the total area goes up by 5% and the area under wheat production goes up by 12%, then what will be the angle for wheat in the new pie chart? 10
Note:
- All those enrolled can send their answers for evaluation in PDF format after scanning (you can use any scanner app) on ccsevaluations@gmail.com
- Name your file as your name and day. For example, if your name is Ashok Kumar and you are sending answer of Day 1 for History, your file should be named as AshokKumar_History_Day1
- Answers will be evaluated within 2 days.
- Click here for Solution of all Daily Problem Practice Questions for enrolled students.