Q. Out of the two bar graphs provided below, one shows the amounts (in Lakh Rs.) invested by a Company in purchasing raw materials over the years and the other shows the values (in Lakh Rs.) of finished goods sold by the Company over the years. 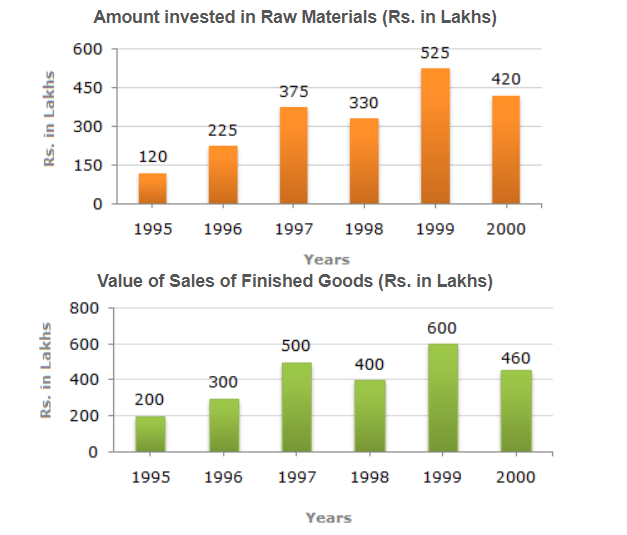
Q. What was the maximum difference between the amount invested in Raw materials and value of sales of finished goods during the year? 6
Q. What percent of the sum of amount invested in Raw materials in the years 1997, 1998 and 1999 was the value of sales of finished goods in 1999? 6
Q. What was the difference between the average amount invested in Raw materials during the given period and the average value of sales of finished goods during this period? 6
Q. In which year, the percentage change (compared to the previous year) in the investment on Raw materials is same as that in the value of sales of finished goods? 10
Q. In which year, there has been a maximum percentage increase in the amount invested in Raw materials as compared to the previous year? 8
Note:
- All those enrolled can send their answers for evaluation in PDF format after scanning (you can use any scanner app) on ccsevaluations@gmail.com
- Name your file as your name and day. For example, if your name is Ashok Kumar and you are sending answer of Day 1 for History, your file should be named as AshokKumar_History_Day1
- Answers will be evaluated within 2 days.
- Click here for Solution of all Daily Problem Practice Questions for enrolled students.