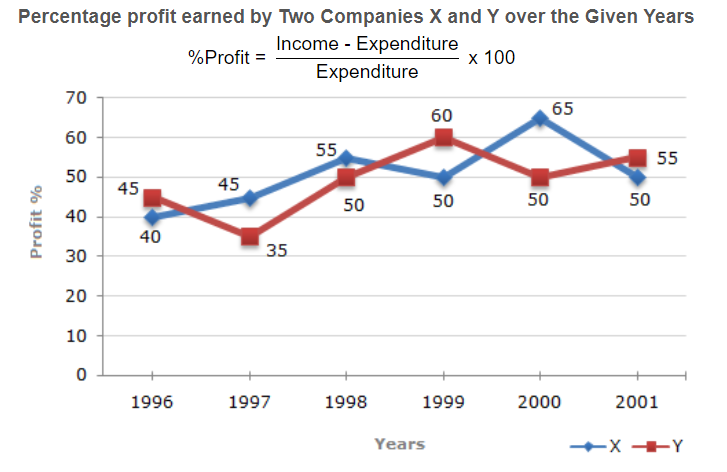
The following line graph gives the percent profit earned by two Companies X and Y during the period 1996 – 2001.
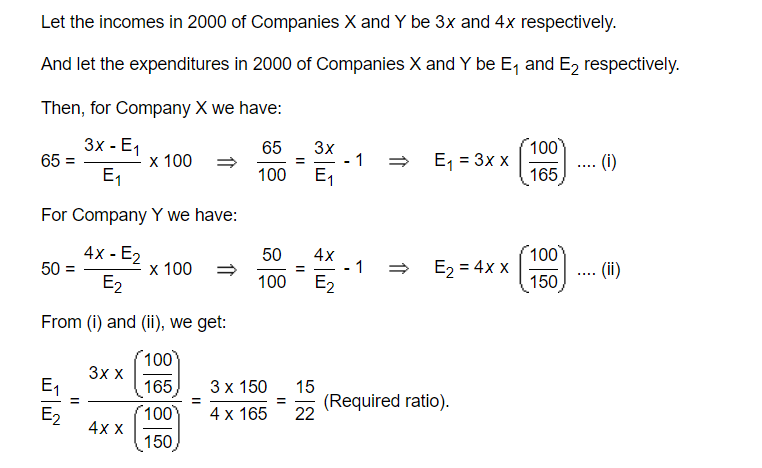
(a) The incomes of two Companies X and Y in 2000 were in the ratio of 3:4 respectively. What was the respective ratio of their expenditures in 2000? 9
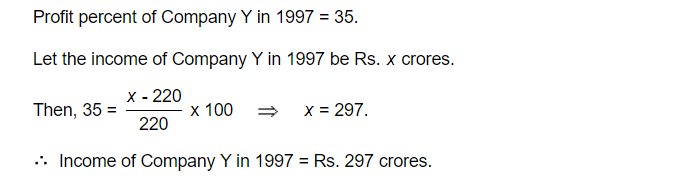
(b) If the expenditure of Company Y in 1997 was Rs. 220 crores, what was its income in 1997? 6
(c) If the expenditures of Company X and Y in 1996 were equal and the total income of the two Companies in 1996 was Rs. 342 crores, what was the total profit of the two Companies together in 1996? 9
(d) The expenditure of Company X in the year 1998 was Rs. 200 crores and the income of company X in 1998 was the same as its expenditure in 2001. What was the income of Company X in 2001? 6

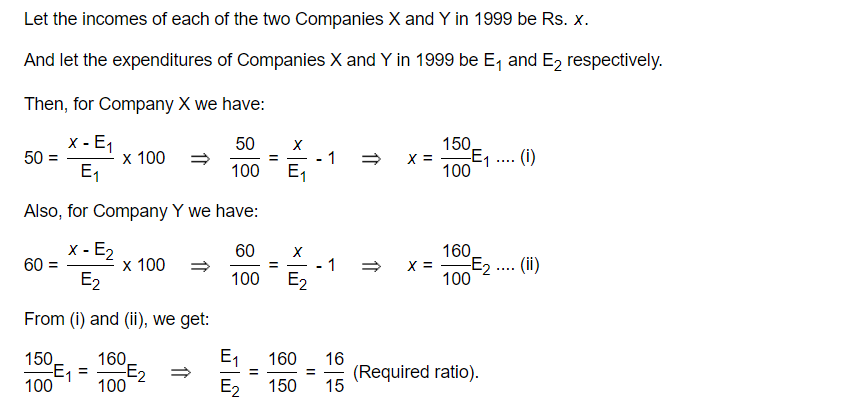
(e) If the incomes of two Companies were equal in 1999, then what was the ratio of expenditure of Company X to that of Company Y in 1999? 6