Q. Out of the two bar graphs provided below, one shows the amounts (in Lakh Rs.) invested by a Company in purchasing raw materials over the years and the other shows the values (in Lakh Rs.) of finished goods sold by the Company over the years. 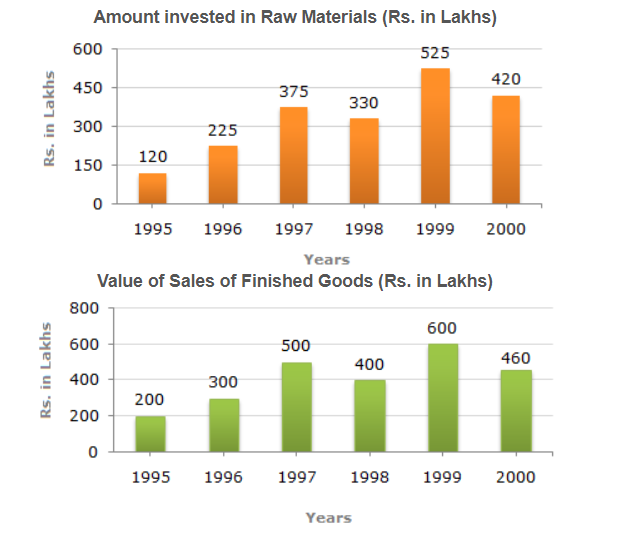
- What was the maximum difference between the amount invested in Raw materials and value of sales of finished goods during the year? 6
- What percent of the sum of amount invested in Raw materials in the years 1997, 1998 and 1999 was the value of sales of finished goods in 1999?6
- What was the difference between the average amount invested in Raw materials during the given period and the average value of sales of finished goods during this period? 6
- In which year, the percentage change (compared to the previous year) in the investment on Raw materials is same as that in the value of sales of finished goods? 10
- In which year, there has been a maximum percentage increase in the amount invested in Raw materials as compared to the previous year? 8
NOTE:
- All those enrolled can send their answers for evaluation in PDF format after scanning (you can use any scanner app) on ccsevaluations@gmail.com
- Name your file as your name and day. For example, if your name is Ashok Kumar and you are sending answer of Day 1 for History, your file should be named as AshokKumar_History_Day1
- Answers will be evaluated within 2 days.
- Click here for Solution of all Daily Problem Practice Questions for enrolled students.