Q. The following graph shows the expenditure on arms of the three countries A, B and C (in ₹ thousand millions). Answer the questions that follow on the basis of the graph: 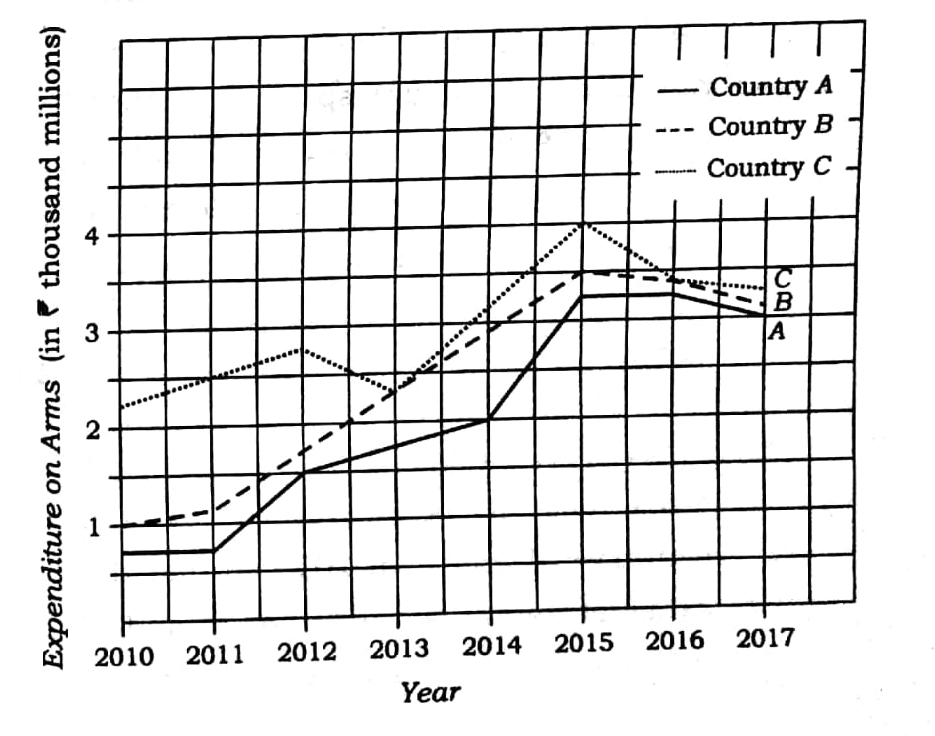
- Which country had the steepest rise in its expenditure on arms compared to the previous year and in which year? 5
- What was the percentage increase in expenditure on arms of country A in 2017 compared to 2012? 5
- The amount spent by country B in 2017 is what percentage of amount spent by it in 2011? 5
- If in 2018, the amount spent by country C will be 30% more than that in the last year and the amount spent by country A in 2018 remains same as that in 2017, what will be the difference between the amounts spent by the countries C and A in arms in the year 2018? 11
- What percentage of expenditure on arms should be increased by the countries A and B in 2015 so that the expenditure on arms by A, B and C becomes same for the year 2015? 10
NOTE:
- All those enrolled can send their answers for evaluation in PDF format after scanning (you can use any scanner app) on ccsevaluations@gmail.com
- Name your file as your name and day. For example, if your name is Ashok Kumar and you are sending answer of Day 1 for History, your file should be named as AshokKumar_History_Day1
- Answers will be evaluated within 2 days.
- Click here for Solution of all Daily Problem Practice Questions for enrolled students.