- Bihar is one of the prominent labour surplus states in India. Bihar supplies both skilled and unskilled labour to other parts of the country, as well as to the foreign ones.
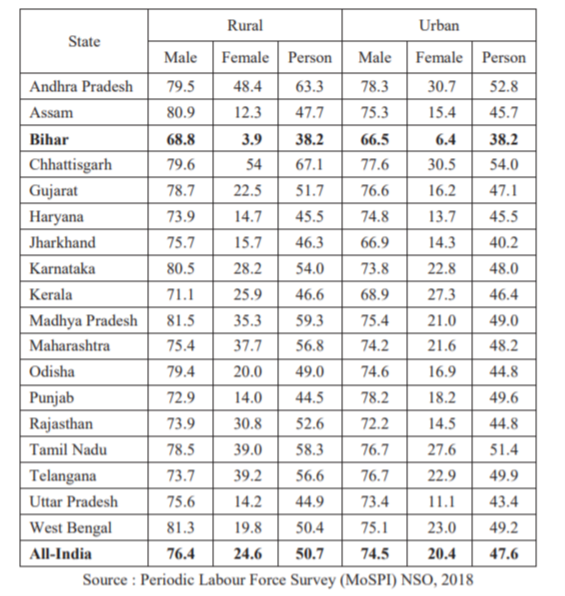
- During 2017-18, the labour force participation rate (LFPR) for males and females in Bihar was lower than the all-India average.
- Importantly, the LFPR for females was abysmally low in Bihar compared to the all-India average. e.g. female LFPR in rural Bihar was just 3.9 percent compared to 24.6 percent at the all-India level.
- Similarly, LFPR for urban females was 6.4 percent in Bihar, compared to 20.4 percent at the all India level.
- Such abysmally low level of LFPR of females is a matter of concern for the policymakers.
- The reasons for such a low level of LFPR for females are multidimensional — social, economic and cultural.
- For male workers also, the LFPR in Bihar was the lowest among all the states in both rural and urban areas.
- Importantly, the LFPR for females was abysmally low in Bihar compared to the all-India average. e.g. female LFPR in rural Bihar was just 3.9 percent compared to 24.6 percent at the all-India level.
- The WPR for both male and female workers has been very low in Bihar vis-à-vis the all-India average.
- In rural Bihar, the WPR for male workers was 64.0 percent, almost 8 percent lower than the all-India average.
- The WPR for female workers was abysmally low at 3.9 percent in rural Bihar. However, the WPR for female workers in urban Bihar was significantly higher at 6.1 percent, compared to WPR for rural females.
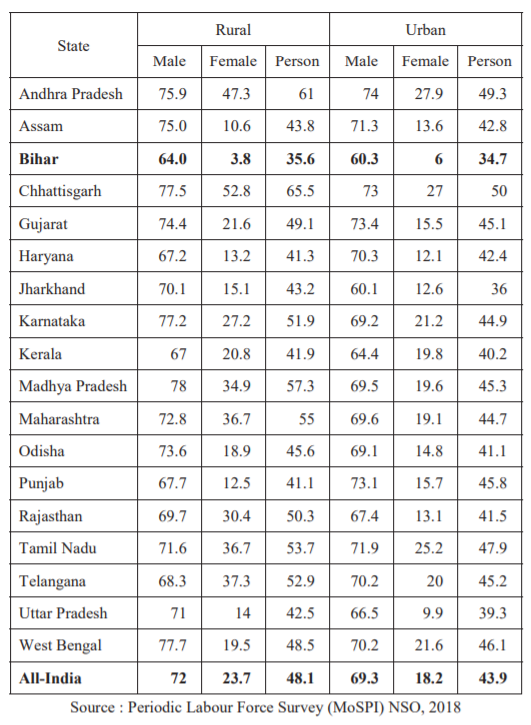
- Given the size of 2.69 crore of female population in the age group of 15 years and above, only 4.1 percent (10.75 lakh females) were engaged in any kind of gainful economic activities in Bihar.
- It clearly suggests that an overwhelming majority of the employable population in Bihar has been out of work.
- It is necessary for the State Government to draw alternative strategies to harness the available human resources in the state which can lead to higher levels of social and economic development.
- Bihar’s unemployment rate is higher than the all-India average:
- According to the 2018-19 Periodic Labour Force Survey (PLFS), the official source of employment statistics in India, the unemployment rate in Bihar was 10.2%, way above the all-India average of 5.8%.
- The data shows that joblessness in Bihar has been worsening vis-a-vis the rest of India. In 2004-05, Bihar’s unemployment rate was 0.8 times the all-India unemployment rate. This ratio has increased over the years. It was 1.6 in 2011-12, 1.2 in 2017-18, and 1.8 in 2018-19.
- In Bihar, the unemployment rate for male workforce was higher than that at the all-India level, while the female unemployment rate was much lower than the all-India level.
- The pattern was similar in both urban and rural areas. A plausible reason for the low unemployment rate among females is that majority of them cannot afford to be unemployed due to their poverty and, as such, are forced to accept employment even at a very low wage.
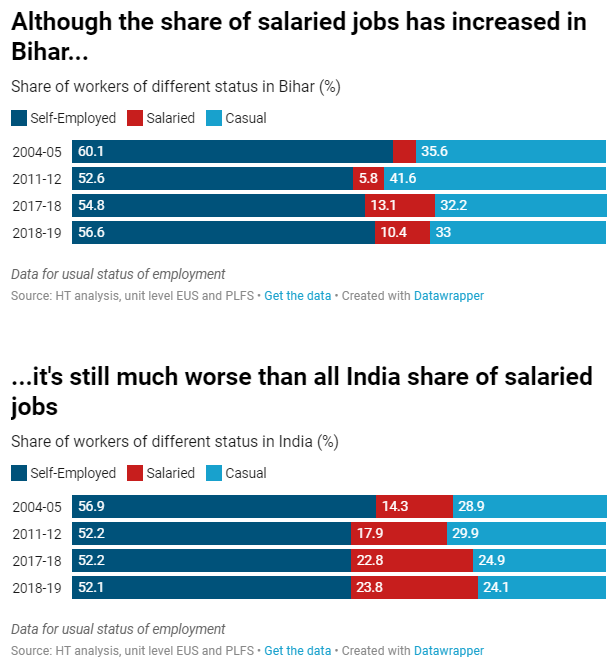
- The quality of jobs in Bihar is also lagging. Bihar fares worse than the all-India average when it comes to the share of workers who have a regular job.
- According to the 2018-19, PLFS, 23.8% of India’s workers had a salaried job. This number was just 10.4% for Bihar.
- The share of workers with a salaried job has increased from 4.2% in 2004-05 Employment Unemployment Surveys (EUS), which corresponds with the period when Nitish Kumar took over the chief minister of the state. However, the points remains that it is still significantly worse than the all-India situation.
Pattern of Employment
- The broad categories of status in employment are — self-employed, regular wage/salary and causal labour.
- In Bihar, major employment-generating industries (in 2017-18 ) for working males were — agriculture, forestry and fishing (44.6 percent), construction (17.1 percent), wholesale and retail trade, repair of vehicles (12.3 percent), and manufacturing (9.3 percent).
- For female workers, major employment-generating industries were — agriculture, forestry and fishing (53.6 percent), education (25.7 percent), and accommodation and food service activities (5.2 percent).
- The pattern of engagement of male workers in various industries of Bihar had similarity with the all-India pattern.
- However, the pattern of engagement of female workers in Bihar was strikingly different from that of the all-India pattern.
- For instance, in Bihar, after agriculture, forestry and fishing, the most important employment provider to the female workers was education, contrary to the common perception that construction or manufacturing would be the second largest employment provider to the female workers.
- Only 3.2 percent of female workers were engaged in manufacturing in Bihar, compared to 12.5 percent at the all-India level.
- The large share of female workers engaged in the education industry manifests the success of the state-sponsored schemes and programmes currently underway in Bihar.
- Given the small number of female workers in Bihar, a significantly large fraction of them were engaged in the services sector, the sector where remuneration and work environment are relatively better.
- The state has sought to increase women’s formal employment through 35 percent reservation in all government jobs in the state. The State Government had announced reservation of 50 percent for women in cooperative societies and in Panchayat to improve the female LFPR in the state.
Migration:
- The economic history of India confirms that Bihar has been an uninterrupted source of migrant workers at different stages of economic and social development in India.
- Bihar sees the biggest outmigration for work among major states:
- Lack of quality jobs in the state has forced Bihari workers to out-migrate for employment. According to data from the 2011 census, Bihar had the highest share of migrants who moved out for work, employment or business reasons.
- A 2018 World Bank paper found that migrant remittances had a share of 35% in Bihar’s gross state domestic product (GSDP) and positively affected consumption at the household level.
- A disproportionate dependence on remittance incomes must have hurt Bihar more than other states after the nationwide lockdown imposed in the aftermath of the coronavirus disease outbreak.
- Historically, migration to international locations has also been observed. The data from Census 2011 suggest that workers from Siwan, Gopalganj, West Champaran and East Champaran districts in Bihar often migrate to the gulf countries.
- In India, their most favoured destinations have been the economically prosperous states like Maharashtra, Delhi, Punjab, Haryana and Karnataka.
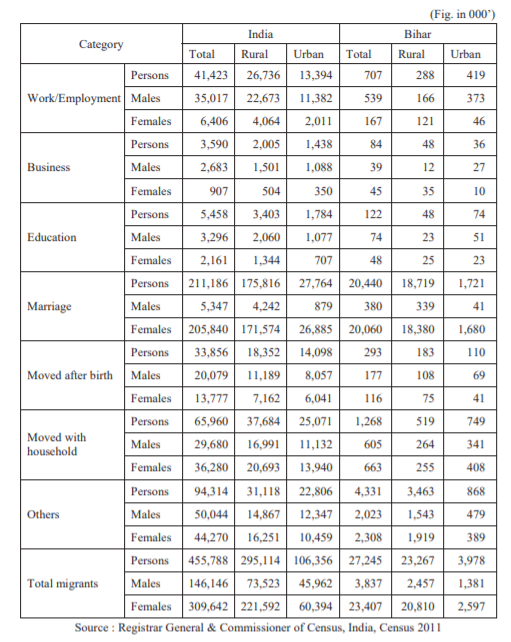
- Census 2011 provides information on number of migrants and their reasons for migration. The major reasons of migration are work/employment, business, education, marriage, moved after birth, moved with the household, etc.
- In Bihar, 75 percent of total migration took place due to marriage, compared to 46 percent at the all-India level.
- Only 2.9 percent of total migration took place due to work/employment and business.
- Of the total number of migrating people due to marriage, 98 percent were women.
- Moreover, of the total migrating people due to work, employment and business, 76 percent of them were men.
- Reason and Gender-wise Migration in India and Bihar (2011 Census):
- These two patterns indicate that in India, more specifically in Bihar,
- Firstly, migration due to social norms and customs has been overwhelmingly dominant over economic reasons of migration.
- Secondly, migration of women has been primarily controlled by social and cultural factors, and the migration of men has been determined by economic factors.
- As regards international migration, one can get some indirect evidence from the emigration clearances at the Indian airports.
- As per this data, Bihar accounted for 15 percent of emigration clearance, which is the second highest after Andhra Pradesh (31 percent).
- Yet another indicator of international migration is the number of passport application received and issued from the Regional Passport Office in Patna. On an average, the number of passports issued from Regional Passport Office in Patna is more than 3 lakhs per year and it is indeed a large number.