Q. The following multiple bar chart shows production of same type of vehicle (in thousands) for a period of three years by selected manufacturers and the in line chart shows prices of vehicles in the year 2017: 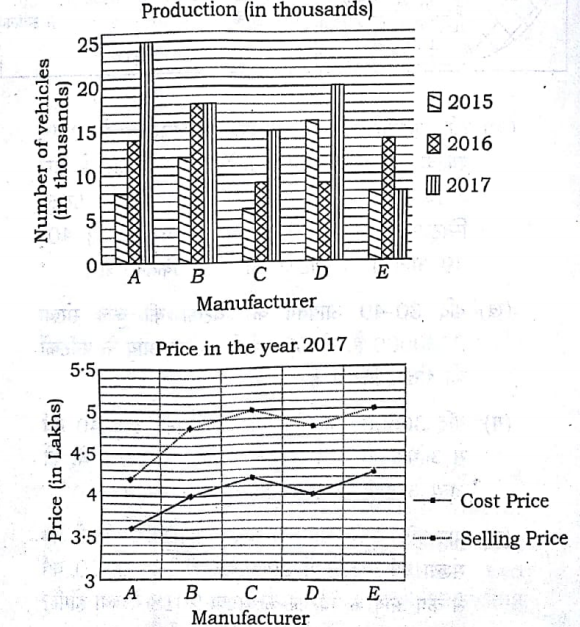 (a) What is the percentage increase in the production of vehicles in 2017 from 2015? 6
(b) Which manufacturers have produced the same number of vehicles during the period under consideration? 6
(c) What percentage of the total production of vehicles is produced by manufacturers A and D? 9
(d) For which manufacturer, the profit percent is maximum in the year 2017? 6
(e) If the manufacturer D had to call back 4000 of its vehicles due to some defects, what is percent profit/loss of the company? 9
NOTE:
- All those enrolled can send their answers for evaluation in PDF format after scanning (you can use any scanner app) on ccsevaluations@gmail.com
- Name your file as your name and day. For example, if your name is Ashok Kumar and you are sending answer of Day 1 for History, your file should be named as AshokKumar_History_Day1
- Answers will be evaluated within 2 days.
- Click here for Solution of all Daily Problem Practice Questions for enrolled students.