Q. The bar graph given below shows the data of the production of paper (in lakh tonnes) by three different companies X, Y and Z over the years.
Production of Paper (in lakh tonnes) by Three Companies X, Y and Z over the Years.
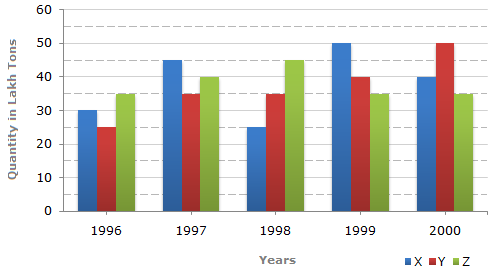
- For which years, the percentage rise/fall in production from the previous year is the maximum for Company Y? 6
- What is the ratio of the average production of Company X in the period 1998-2000 to the average production of Company Y in the same period? 6
- The average production for five years was maximum for which company? 6
- In which year was the percentage of production of Company Z to the production of Company Y the maximum? 6
- What is the percentage increase in the production of Company Y from 1996 to 1999? 6
- What is the difference between the production of Company Z in 1998 and Company Y in 1996? 6
NOTE:
- All those enrolled can send their answers for evaluation in PDF format after scanning (you can use any scanner app) on ccsevaluations@gmail.com
- Name your file as your name and day. For example, if your name is Ashok Kumar and you are sending answer of Day 1 for History, your file should be named as AshokKumar_History_Day1
- Answers will be evaluated within 2 days.
- Click here for Solution of all Daily Problem Practice Questions for enrolled students.